Research Report by Climate Central
November 2017
Summary
| Read “Breathing Fire,” our feature story on fire pollution |
Smoke pollution is leading to serious public health impacts as large wildfires across the American West become more frequent and destructive. These fires are undermining progress made during recent decades in reducing pollution from tailpipes, power plants, and other industrial sources. The increasing frequency and area burned by large fires is linked to human-caused climate change as well as other environmental changes.
Climate Central analyzed air quality trends from 2000 through 2016 in two large California air basins that are heavily affected by smoke pollution. The analysis focused on particulate matter (PM2.5), a dangerous air pollutant. We found that while the air is getting cleaner overall in recent years, it’s getting dirtier during the fire season — a season that research has shown is growing longer in the western United States.
California’s Central Valley — Climate Central Analysis
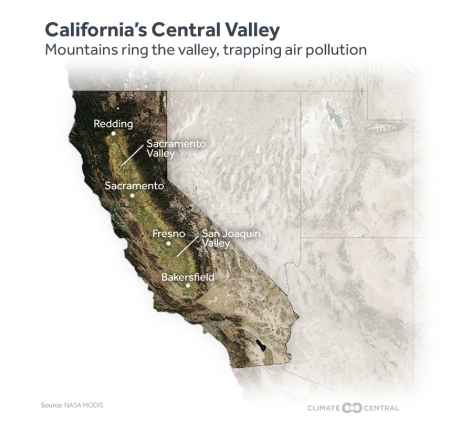
The Central Valley is a large, flat region that dominates California’s geographic center. The valley comprises some 11 percent of the state’s land area and includes population centers such as Sacramento and Fresno, but the majority of the region is made up of farmland — some of the most productive on the planet.
Central Valley air quality was analyzed because the region is heavily affected by air pollution that is produced within an even larger geographical area. Bounded by mountain ranges to both the east and the west, the valley’s geographical and meteorological features combine with industrial activity such as truck traffic to contribute to these high levels of pollution. Some of the pollution is generated within the valley, while other pollution sources include wildfires burning along the coast to the west and in the Sierra Nevada mountain range to the east.

Wildfires are a source of an especially problematic type of air pollutant known as PM2.5 (“particulate matter” less than 2.5 microns in diameter), which can become lodged in lungs and cause or exacerbate a wide array of health problems such as asthma and heart disease. Emerging evidence suggests PM2.5 could also be linked to premature births. Other PM2.5 sources include a wide variety of industrial and agricultural activities. To protect human health, the U.S. Environmental Protection Agency has established both daily (24-hour) and annual standards for PM2.5 of 35 µg/m3 and 12 µg/m3, respectively.1
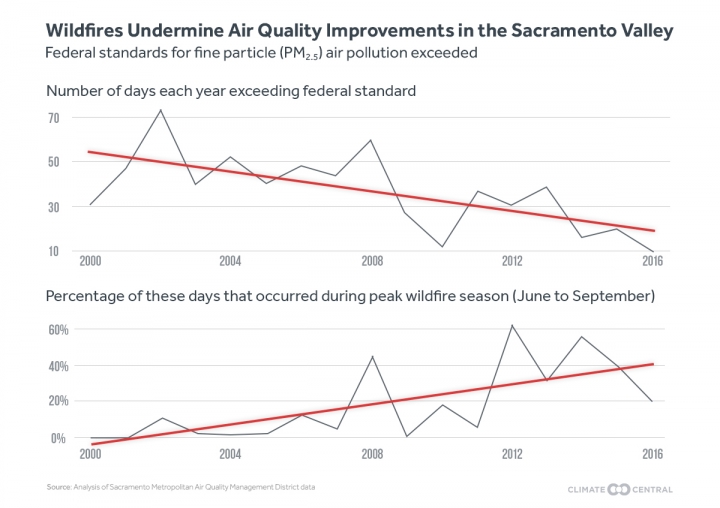
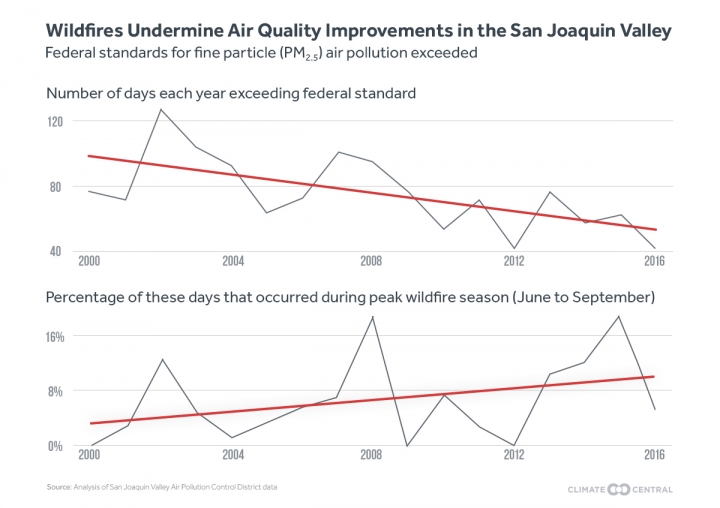
To examine the contribution of wildfires to levels of PM2.5 in the Central Valley, Climate Central compared the number of days PM2.5 exceeded federal standards at at least one station in each air basin for the entire year, with the number of days the pollutant exceeded federal standards during the summer wildfire season from June to September. The analysis covered the period 2000 to 2016 and was conducted separately for two air basins comprising the Central Valley — the Sacramento Valley and the San Joaquin Valley. Together, these valleys cover 20,000 square miles2 and are home to nearly 6.7 million people.3
Between 2000 and 2016, air quality in both the Sacramento Valley and the San Joaquin Valley improved, with the number of days per year with 24-hour PM2.5 exceedances falling by roughly 64 percent and 45 percent overall, respectively.
Amid this overall trend, a growing percentage of exceedances are occurring during peak fire season and when PM2.5 are typically low. That points to the increasing role of wildfires as a source of air pollution even as emissions from other sources continue to fall. The Sacramento Valley is now seeing some years with 50 to 60 percent of PM2.5 exceedances occurring during these months. In the earlier part of the period studied, summer exceedances typically accounted for less than 10 percent of the total. There has been a 31 percent increase in the number of exceedances during the summer fire season in the San Joaquin Valley compared to the number of exceedances during the summer fire season in 2000. The increase in proportion of summertime exceedances in the Sacramento Valley air basin has been even more dramatic with nearly a five-fold increase.
Air quality data for the Central Valley prior to 2000 is only partially available. Data prior to 2000 was excluded based on the criterion of having less than 5 percent of the data missing. The data analyzed does not include 2017 because not all winter months have yet occurred this year. Note that winter months historically have the most exceedances.
Because wildfire smoke can blow across county, state and national borders, the correlation between local PM2.5 and nearby wildfire activity is not exact. Comparing periods of exceedances at local levels with satellite images of smoke, however, provides another line of evidence connecting wildfires to PM2.5 pollution.
For example, exceedances in PM2.5 concentrations were detected by air quality monitors at three locations in the Central Valley at the beginning of September 2017, with these exceedances coinciding with an outbreak of wildfires. Just a few days later, widespread smoke was still apparent in satellite images of the region, and there is a visible relationship between air quality data and the smoke. Areas where the wildfires are located and smoke is present largely coincided with measurements showing the worst air quality.

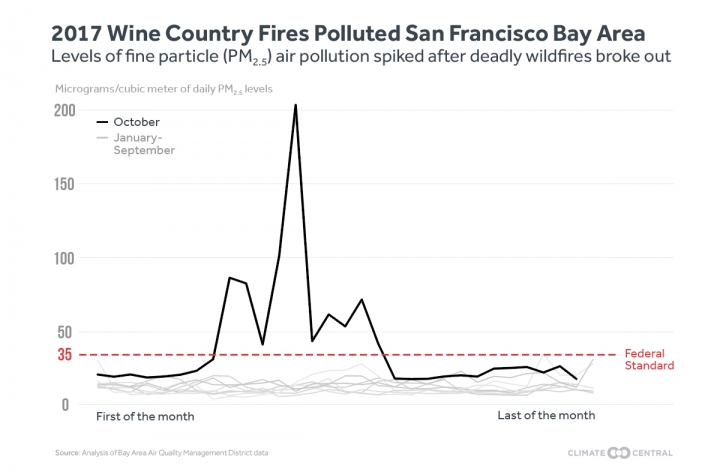
Major wildfires broke out north of San Francisco in early October, 2017, killing more than 40 people.4 Smoke from these North Bay fires spread throughout the San Francisco Bay Area and reached the Central Valley and beyond. Air in the Bay Area air basin is usually cleaner than in the Central Valley, and it has also experienced an overall decline in the number of days each year that PM2.5 exceeds federal standards. Smoke from the October fires heavily polluted the air, with one day in the Bay Area air basin experiencing twice the level of PM2.5 of any day going back to 2001.
Climate Change
Wildfire seasons are projected to become worse due to climate change, expanding in length and increasing the number of large fires and acreage that burns each year. When compared with the 1970s, the average annual Western U.S. wildfire season is now 105 days longer, has three times as many large fires (larger than 1000 acres), and burns more than six times as many acres.5
According to the 2014 National Climate Assessment, warming temperatures and drier conditions are major factors resulting in the increase in wildfires; both temperatures and reduced moisture are linked to human-caused climate change and affect the dryness and flammability of landscapes, measured by scientists as fuel aridity.6 High levels of fuel aridity can provide large areas conducive for the spread of wildfire once ignited.
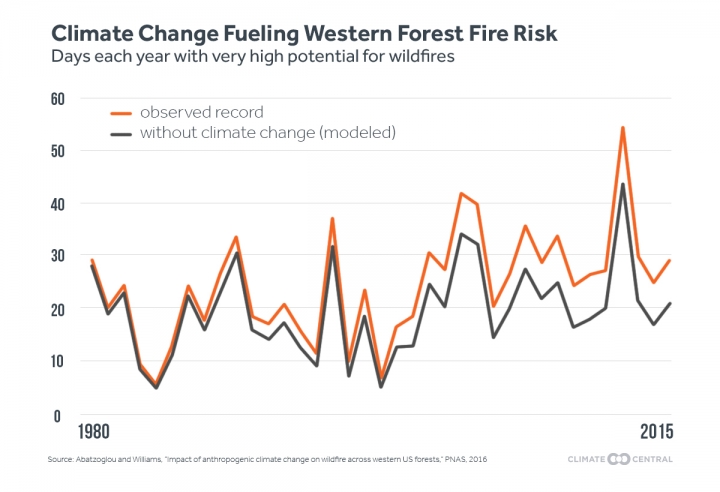
According to one study that looked at eight fuel aridity metrics in the Western U.S. and modeled climate change’s effects on them, human-caused climate change accounted for about 55 percent of the observed increases in fuel aridity between 1979 and 2015 (Figure 6), and added an estimated 4.2 million hectares of forest fire area between 1984 and 2015.7 Based on all eight metrics, the Western U.S. experienced an average of 9 additional days per year of high fire potential due to climate change between 2000 and 2015, a 50 percent increase from the baseline of 17 days per year when looking back to 1979. The correlation between fuel aridity and forest fire area each year was found to be highly significant (R2 = 0.75) for 1984 to 2015.
One of the eight metrics analyzed by the study is the Keetch-Byram drought index (KBDI), a measure of the dryness of the top 8 inches of the forest floor on a scale from 0 to 800. Lower numbers on the scale indicate a higher moisture level on the forest floor and higher numbers on the scale indicate more severe drought and thus higher wildfire potential.
Previous Climate Central research found that under a high-pollution future scenario (i.e., RCP8.5), California would experience an additional 24 days per year with a KBDI value of 600 (the level at which the potential for wildfires is high) or above by 2050.5 The only state with a greater increase in the number of days with high KBDI values is Arizona, at 34 additional days.
Ecosystem changes and natural climatic variation can also have large influences on wildfire seasons. Even without human-caused climate change, wildfires would have increased in many regions due to other human activities and natural factors. In particular, although wildfires are a natural process in Western ecosystems, their roles in keeping forests in healthy condition have not been well understood, and so they are often extinguished as quickly as possible. As a result of strenuous efforts to suppress wildfire and other land-management practices such as livestock grazing, logging, and land-type conversion,8,9 many forests have experienced fire deficits, becoming overgrown and littered with flammable material such as leaf litter and saplings. Wildfires that break out during fire deficits can be unnaturally large and severe.10-12 In addition, the introduction of non-native species, especially invasive grasses, can have significant impacts on grassland wildfires as these plants can provide fuel for fires.13
Wildfire Smoke and Health
One of the greatest concerns with wildfires is their impact on air quality and associated health consequences; PM2.5 is just one of the pollutants in wildfire smoke, but its small size makes it a well-known threat to people’s health. Californians are at particular risk from wildfire-related health impacts, because the state has the largest population in the U.S. living in wildland-urban interface (inhabited areas approaching wildland areas) where there is an elevated risk of being exposed to wildfires.14 More than 11 million people, about 30 percent of the California population, live in these wildland-urban interfaces.5
To explore specific linkages between wildfire smoke and health, Liu et al. (2016) developed the concept of “smoke-wave” days, defined as two or more days in a row with wildfire-specific PM2.5 concentrations above 20µg/m3 (the 98th quantile of wildfire-specific PM2.5 concentrations in the study area).15 In Liu et al. 2017, smoke wave days matched satellite (MODIS) records of large wildfires and the researchers found that as smoke-wave day intensity increased, respiratory admissions to hospitals increased.16 In particular, smoke-wave days with PM2.5 concentrations above 37µg/m3 (the 99.5th quantile) were associated with a 7.2 percent increase in respiratory related admissions to hospitals compared to non-smoke wave days. Cardiovascular admissions tended to be highest during the first two days of a smoke-wave and then decrease, while respiratory admissions exhibited the opposite trend, increasing as the days go by.16
These findings are consistent with other studies, as highlighted in a critical review of the literature on the health impacts of wildfires published in 2016 by Reid et al.17 Various respiratory problems in asthmatics and non-asthmatics alike, measured by physician visits, emergency department visits, and hospitalizations were found to be strongly associated with wildfire smoke exposure as well as significant declines in lung function for those without asthma.17
Included in the review analysis is one study that looks at how measures of community health modified health outcomes from a wildfire in North Carolina. The study found that health effects of wildfire pollution are significantly associated with poverty and income inequality.18 The study first finds that per 100µg/m3 of PM2.5 exposure, there was a 66 percent increase for hospital visits related to asthma on the day of exposure, and a 42 percent increase in visits related to congestive heart failure (CHF) the day after exposure.
The study also finds that those counties ranked lowest on the 2010 County Health Rankings for North Carolina (a measure of overall community health based on specific determinants of community health, such as education, income, access to clinical care, diet and exercise) had significantly higher relative risks of asthma on the days of and immediately after wildfire-associated PM2.5 exposure than those counties ranked highest. Of the factors examined that combine to create the County Health Rankings, the counties ranked lowest for poverty, measured as the number of children below the poverty line, had twice the relative risk of asthma as an outcome from PM2.5 exposure than those counties ranked highest (the largest difference). Counties with the greatest income inequality had 223 percent higher risks of CHF as a health outcome from wildfire pollution.
Wildfire smoke can travel and affect communities hundreds of miles away from its source. The North Bay Fires affected air quality in the Central Valley and satellite images show it traveled more than 500 miles over the Pacific, reaching as far south as Mexico.19 In 2015, smoke from wildfires in central Canada resulted in multiple days of exceedances of EPA standards in Maryland.20 In 2002, wildfire smoke from fires in Quebec impacted populations all along the East Coast of the United States, and a nearly 50 percent increase in hospital admissions for respiratory diagnoses for the elderly was associated with the smoke plume and concurrent PM2.5 in counties in states between New York and Washington, DC.21
The decades of work that have gone into reducing PM2.5 through environmental regulations and technological improvements are being undermined by the West’s worsening wildfire seasons, with large wildfires being amplified by higher temperatures and drier conditions associated with human-caused climate change.
Methodology
Air quality data was acquired from the California Air Resources Board’s query tool site. For the multiyear time series the following selections were made for the Sacramento Valley and San Joaquin Valley Air Basins: PM2.5, daily average, year-at-a-glance. The total number of exceedances, labeled on the site in red, were tallied for the yearly total exceedances. Then the number of exceedances during June, July, August, and September were tallied for peak wildfire season exceedances. The ratio of these two numbers gives the fraction of annual exceedances occurring during wildfire season. This was repeated for all available years for which >95% of the days in a year had a measurement available, which was 2000 to 2016. Linear regression fits to these data were calculated using the R Statistical Software package.22 The data for the San Francisco Bay air basin was queried in a similar manner as above, but instead of recording days above the federal standard the daily average concentrations at the highest monitoring site in the basin are reported by month through October 2017.
About this project
Climate Central is a nonpartisan and non-advocacy nonprofit based in New Jersey that researches and reports on the changing climate. This report was written by Research and Communications Fellow Julia Langer. Data analysis by Climate Scientist Todd Sanford, Ph.D. Additional research by Features Journalist John Upton. Graphics by Multimedia Designer Megan Martin.
Please direct queries to info@climatecentral.org.
“Breathing Fire,” a feature article about wildfire pollution written by John Upton and produced in partnership with Kaiser Health News with support from the Bill Lane Center for the American West at Stanford University, can be read on Climate Central’s website and elsewhere.
We gratefully acknowledge John Abatzoglou (University of Idaho), Ana Rappold (EPA), and Jia Coco Liu (Yale University) for reviewing the analysis and providing helpful feedback on an earlier version of this report, and Loretta Mickley (Johns Hopkins) and Colleen Reid (University of Colorado, Boulder) for providing feedback on an earlier version of the report.
References
- NAAQS Table. Retrieved from https://www.epa.gov/criteria-air-pollutants/naaqs-table
- (2017, Mar. 20). California’s Central Valley. Retrieved from: https://ca.water.usgs.gov/projects/central-valley/about-central-valley.html
- U.S. Census Bureau. (2010). 2010 Census Data 2016 Population Estimates. Retrieved from https://www.census.gov/2010census/data/
- Fimrite, Peter & Alexander, Kurtis. (2017). 17-year-old dies of burns, becomes 43rd victim of California wildfires. SFGate. Retrieved from: http://www.sfgate.com/bayarea/article/17-year-old-dies-of-burns-becomes-43rd-victim-of-12317178.php
- Climate Central, 2016: Western Wildfires: A Fiery Future. Princeton, NJ. http://assets.climatecentral.org/pdfs/westernwildfires2016v2.pdf
- Melillo, Jerry M., Terese (T.C.) Richmond, and Gary W. Yohe, Eds. (2014). Climate Change Impacts in the United States: The Third National Climate Assessment. U.S. Global Change Research Program, 841 pp. doi:10.7930/J0Z31WJ2
- Abatzoglou, J. T. & Williams, A. P. (2016). Impact of anthropogenic climate change on wildfire across western US forests. PNAS, 113(42), 11770-11775. doi:10.1073/pnas.1607171113
- Parks, S. A., Miller, C., Parisien, M., Holsinger, L. M., Dobrowski, S. Z., & Abatzoglou, J. (2015). Wildland fire deficit and surplus in the western United States, 1984-2012. Ecosphere, 6(12). doi:10.1890/ES15-00294.1
- Marlon, J. R., Bartlein, P.J., Gavin, D. G., Long, C. J., Anderson, R. S., Briles, C. E., … Walsh, K. M. (2012). Long-term perspective on wildfires in the western USA. PNAS, 109(9), E535-543. doi:10.1073/pnas.1112839109
- Hessburg, P. F., Churchill, D. J., Larson, A. J., Haugo, R. D., Miller, C., Thomas, A. S., … Reeves, G. H. (2015). Restoring fire-prone Inland Pacific landscapes: seven core principles. Landscape Ecol. 30(10), 1805-1835. doi:10.1007/s10980-015-0218-0
- Stephens, S. L. (2005). Forest fire causes and extent on United States Forest Service lands. International Journal of Wildland Fire, 14, 213-222. doi:10.1071/WF04006
- Calkin, D. E., Thompson, M. P., & Finney, M. A. (2015) Negative consequences of positive feedbacks in US wildfire management. Forest Ecosystems, 2(9). doi:10.1186/s40663-015-0033-8
- Brooks, M. L., D’Antonio, C. M., Richardson, D. M., Grace, J. B., Keeley, J. E., DiTomaso, J. M., … Pyke, D. (2004). Effects of Invasive Alien Plants on Fire Regimes. BioScience, 54(7), 677-688. doi:10.1641/0006-3568(2004)054[0677:EOIAPO]2.0.CO;2
- Radeloff, V.C., Hammer, R. B., Stewart, S. I., Fried, J. S.,Holcomb, S. S., & McKeefry, J. F. (2005). The Wildland Urban Interface in the United States. Ecological Applications, 15(3), 799-805.
- Liu, J. C., Mickley, L. J., Sulprizio, M. P., Yue, X., Peng, R. D., Dominici, F., & Bell, M. L. (2016). Future respiratory hospital admissions from wildfire smoke under climate change in the Western US. Environmental Research Letters, 11. doi:10.1088/1748-9326/11/12/124018
- Liu, J. C., Wilson, A., Mickley, L. J., Dominici, F., Ebisu, K., Wang, Y., … Bell, M. L. (2017). Epidemiology, 28(1), 77-85. doi:10.1097/EDE.0000000000000556
- Reid, C. E. Brauer, M., Johnston, F. H., Jerrett, M. Balmes, J. R., & Elliot, C. T. (2016). Critical Review of Health Impacts of Wildfire Smoke Exposure. Environmental Health Perspectives, 124(9), 1334-1343. doi:10.1289/ehp.1409277
- Rappold, A. G., Cascio, W. E., Kilaru, V. J., Stone, S. L., Neas. L. M. Delvin, R. B., & Diaz-Sanchez, D. (2012). Cardio-respiratory outcomes associated with exposure to wildfire smoke are modified by measures of community health. Environmental Health, 11(71). doi:10.1186/1476-069X-11-71
- Robertson, M. (2017). Smoke from Wine Country fires traveled as far as Mexico, over 500 miles south. SFGate. Retrieved from http://www.sfgate.com/local/article/Smoke-from-the-Wine-Country-fires-from-space-12279248.php#photo-14353203
- Dreessen, J., Sullivan, J., & Delgado, R. (2016). Observations and impacts of transported Canadian wildfire smoke on ozone and aerosol air quality in the Maryland region on June 9-12, 2015. Journal of the Air & Waste Management Association, 66(9), 842-862. Doi: 10.1080/10962247.2016.1161674
- Le, G. E., Breysse, P. N., McDermott, A., Eftim, S. E., Geyh, A., Berman, J. D., & Curriero, F. C. (2014). Canadian Forest Fires and the Effects of Long-Range Transboundary Air Pollution on Hospitalizations among the Elderly. ISPRS International Journal of Geo-Information, 3, 713-731. doi:10.3390/ijgi3020713
- R Core Team (2014). R: A language and environment for statistical computing. R Foundation for Statistical Computing, Vienna, Austria. URL http://www.R-project.org/.
![]()